The question
In a previous post, I walked through the Harville method — a long-standing approach to converting win probabilities into predictions for every finishing position. It’s elegant and simple, but it carries well-known limitations. Most notably, it tends to over-concentrate favorites near the top of the board and push longshots too aggressively toward the bottom.
So I asked a simple question: can we do better without adding complexity?
That’s where DeepOutcomes comes in.
Same inputs, better predictions
DeepOutcomes uses the same information as Harville: each horse’s win probability and the number of horses in the race. That’s it.
But instead of relying on a fixed analytical formula, it learns from real race outcomes how horses actually distribute across finishing positions. The result is a set of predictions that better reflects what happens on the track — not what a clean mathematical assumption would suggest.
Example: 2025 Belmont Stakes
Under the Harville method, the two co-favorites — Journalism and Sovereignty — are heavily concentrated at the top of the board. Their chances of finishing near the back of the field are vanishingly small.
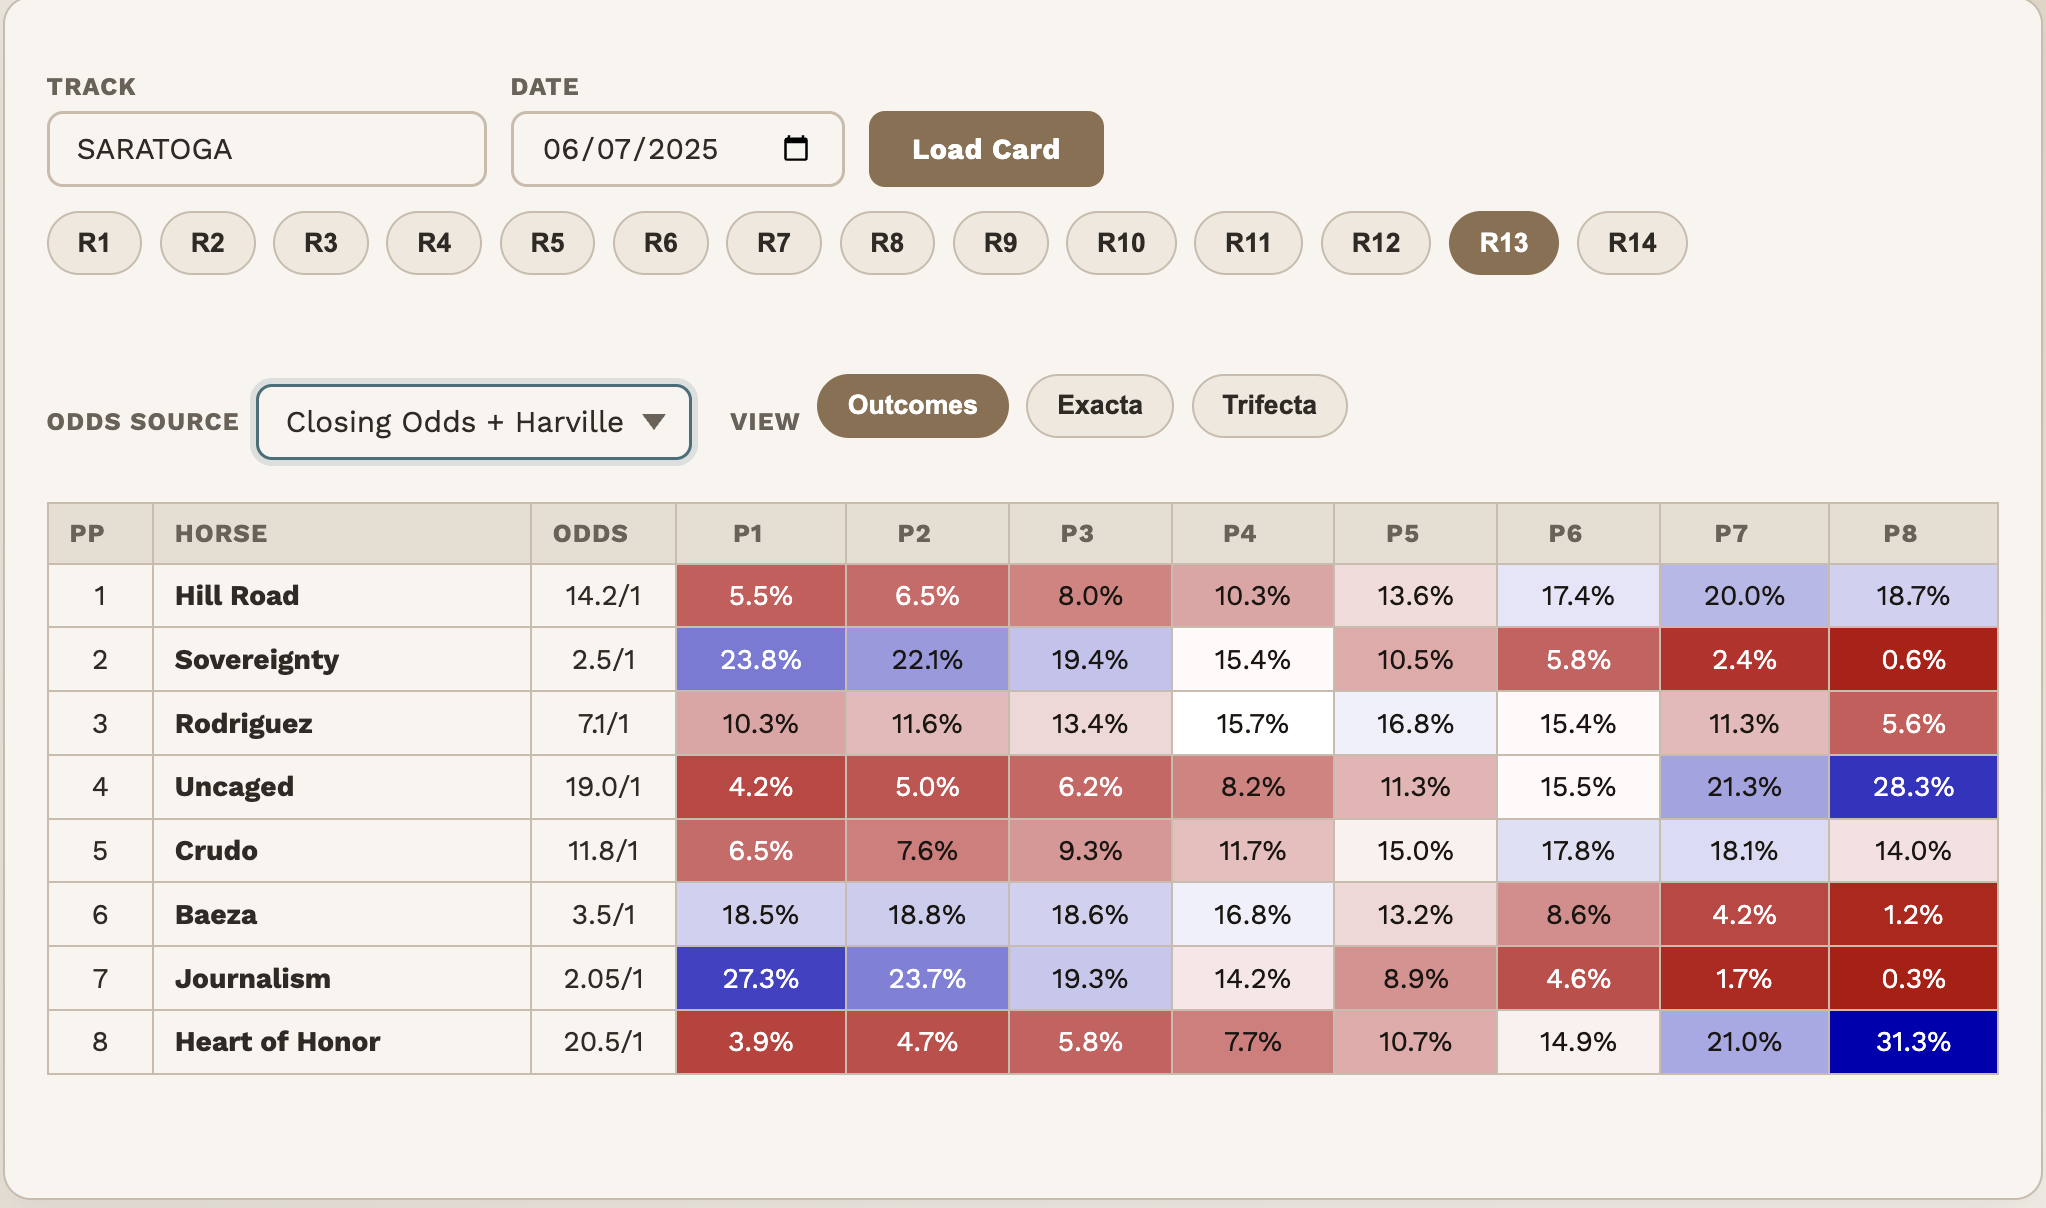
But in reality, even strong favorites can suffer a bad trip, a poor pace scenario, or simply an off day. DeepOutcomes adjusts for this. We all know they went on to finish 1-2, but is this representative of all races?
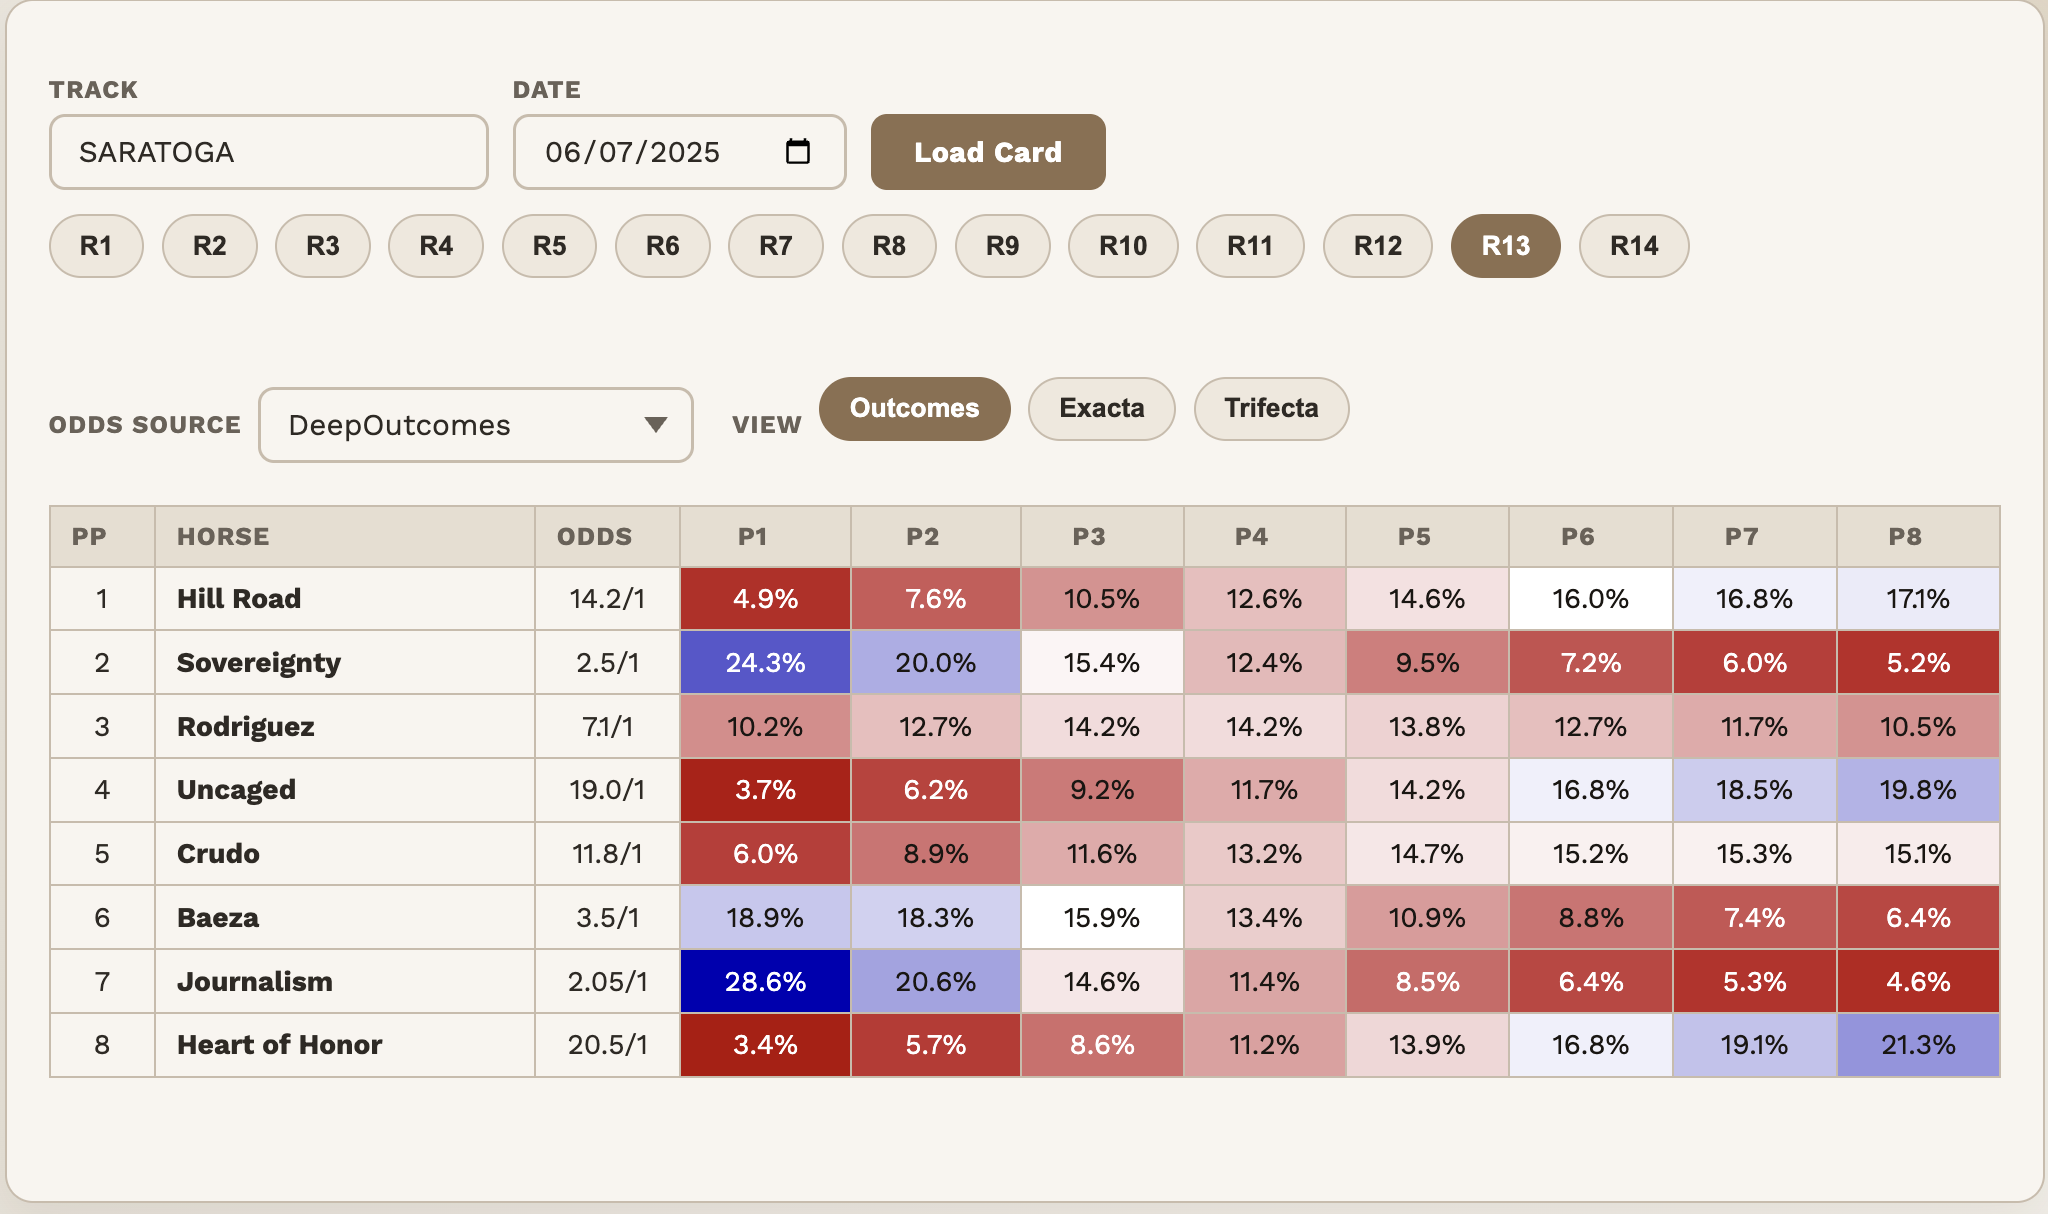
- Journalism & Sovereignty — more realistic downside Both horses are assigned meaningfully higher chances of finishing near the back of the field (7th or 8th). Harville underestimates how badly even strong horses can underperform on a rough day.
- Heart of Honor — off the basement floor The longshot is no longer pushed almost entirely into last place. DeepOutcomes spreads more of its probability into mid-pack finishes (4th–6th). Still unlikely to win — but more realistic about not always finishing last.
The data
One example is an anecdote. The 2025 full season is data. Across roughly 29,000 races, we can ask two questions of each model.
Question 1: How often are you right, and how wrong are you when you’re not? We measure this with log loss — think of it as a penalty score where being confidently wrong hurts more than being uncertain. Lower is better.
Overall, DeepOutcomes scores 1.898 against Harville’s 1.963 — about 3.3% better. That’s meaningful across a full season, but it understates the story. The gap is widest exactly where Harville’s structural bias is worst: at the top and bottom of the field.
| Slice | DeepOutcomes | Harville | Improvement |
|---|---|---|---|
| Overall | 1.898 | 1.963 | +3.3% |
| Favorite (rank 1) | 1.633 | 1.750 | +6.7% |
| 2nd favorite (rank 2) | 1.853 | 1.938 | +4.4% |
| Longest shot (last) | 1.689 | 1.761 | +4.1% |
The improvement on favorites is particularly striking — 6.7% better. This is Harville’s blind spot in full view: it assumes that once you remove the winner, the remaining field is just a proportionally rescaled version of itself. In practice, when a heavy favorite loses, they tend to really lose — finishing mid-pack or worse, not just missing the win by a nose. DeepOutcomes learns this from the data. Harville cannot, by design.
The gain on longshots (4.1%) tells the other side of the same story. Harville pushes them toward the back of every field almost mechanically. Real longshots are volatile — they occasionally run big, and they don’t always finish last.
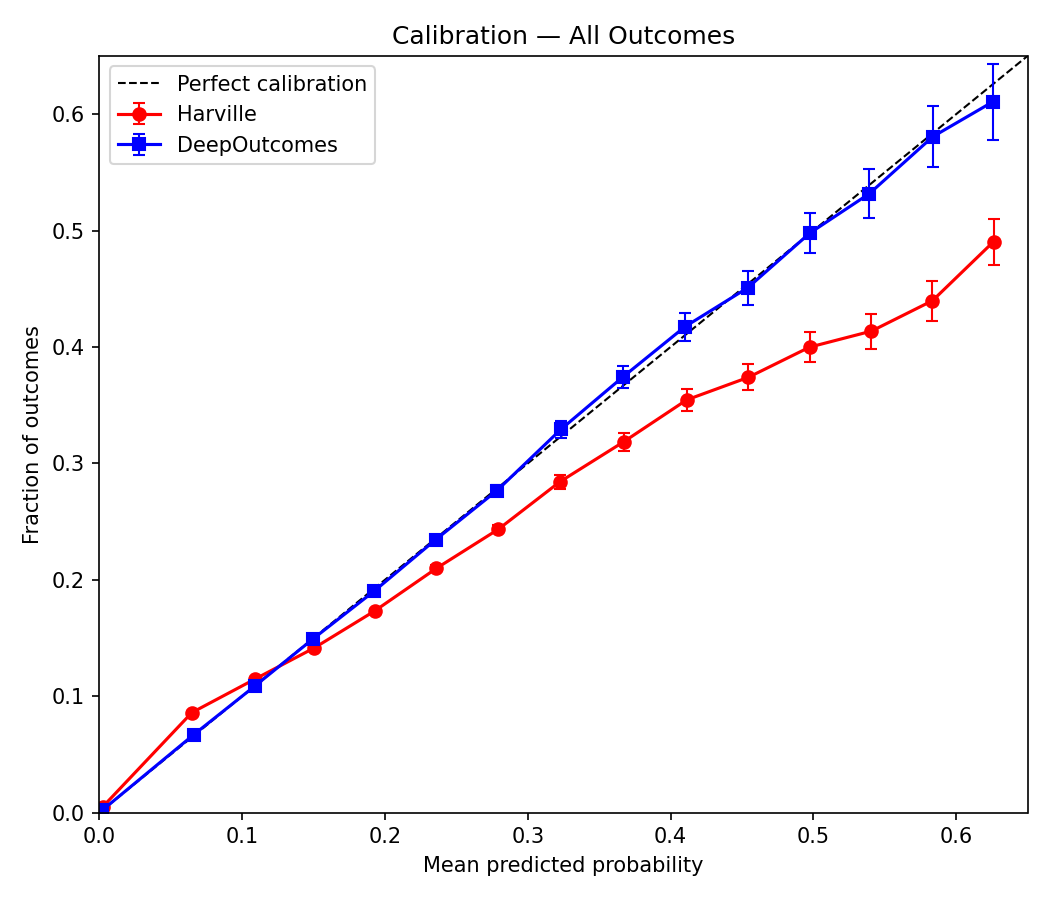
Question 2: When you say something happens 22% of the time, does it? This is calibration — arguably the more important property for anyone using these probabilities to make decisions.
A perfect model tracks the diagonal exactly: predicted probability matches observed frequency at every point. In the chart below, DeepOutcomes (blue) does that quite well across the board. Harville manages reasonable calibration in the 0.1–0.2 range, but otherwise struggles — it underpredicts rare outcomes (a 5% prediction actually occurs about 8% of the time) and overpredicts common ones (a 50% prediction actually occurs only around 38% of the time).
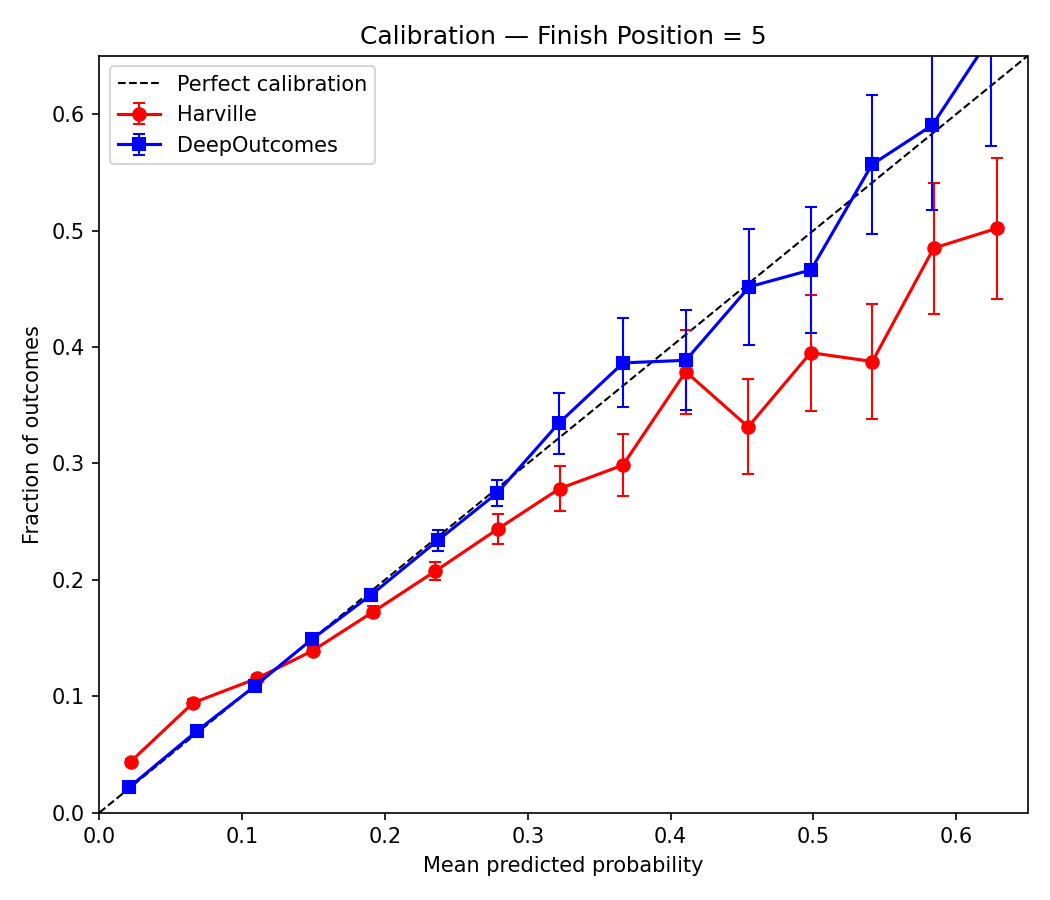
The same pattern holds at any individual position. Here’s the calibration for predicting fifth-place finishes specifically. Small sample sizes make the far right a bit noisy, but the story is the same throughout.
The bottom line
You don’t need more data to get better predictions. You need a better way to use the data you have.
DeepOutcomes keeps things simple — but produces outcomes that look a lot more like real races. It’s right more often, and when it’s wrong, it’s less wrong. It’s also well-calibrated. Two critical properties of a model worth trusting.
Deep neural networks, applied carefully and without overcomplicating the inputs, extract structure from racing data that a closed-form formula simply cannot capture. In a sport where unpredictability is the norm, that’s a meaningful edge.
Comments
No comments yet. Be the first to share your thoughts.
Have thoughts? Sign in to comment.