One approach to finishing order — and why it still matters even when it’s wrong.
2026 Florida Derby · Morning Line Probabilities
Favorite
28.7%
Chief Wallabee (2-1)
Longshot
4.1%
Timeless Victory (20-1)
The market is good at predicting winners. It’s the finishing order where things get murky fast.
The core idea
If you’ve ever bet on a race — horses, Formula 1, anything with a finishing order — you’ve noticed something: the market is pretty good at telling you who’s likely to win. But the moment you ask “what are the chances the favorite finishes in the top two?” or “what’s the probability of an exacta with these two horses?”, things get murky fast.
There are many ways to approach this, from deep neural networks to astrology signs. We need to start somewhere, though. So let’s start with the original: the Harville method.
The 2026 Florida Derby
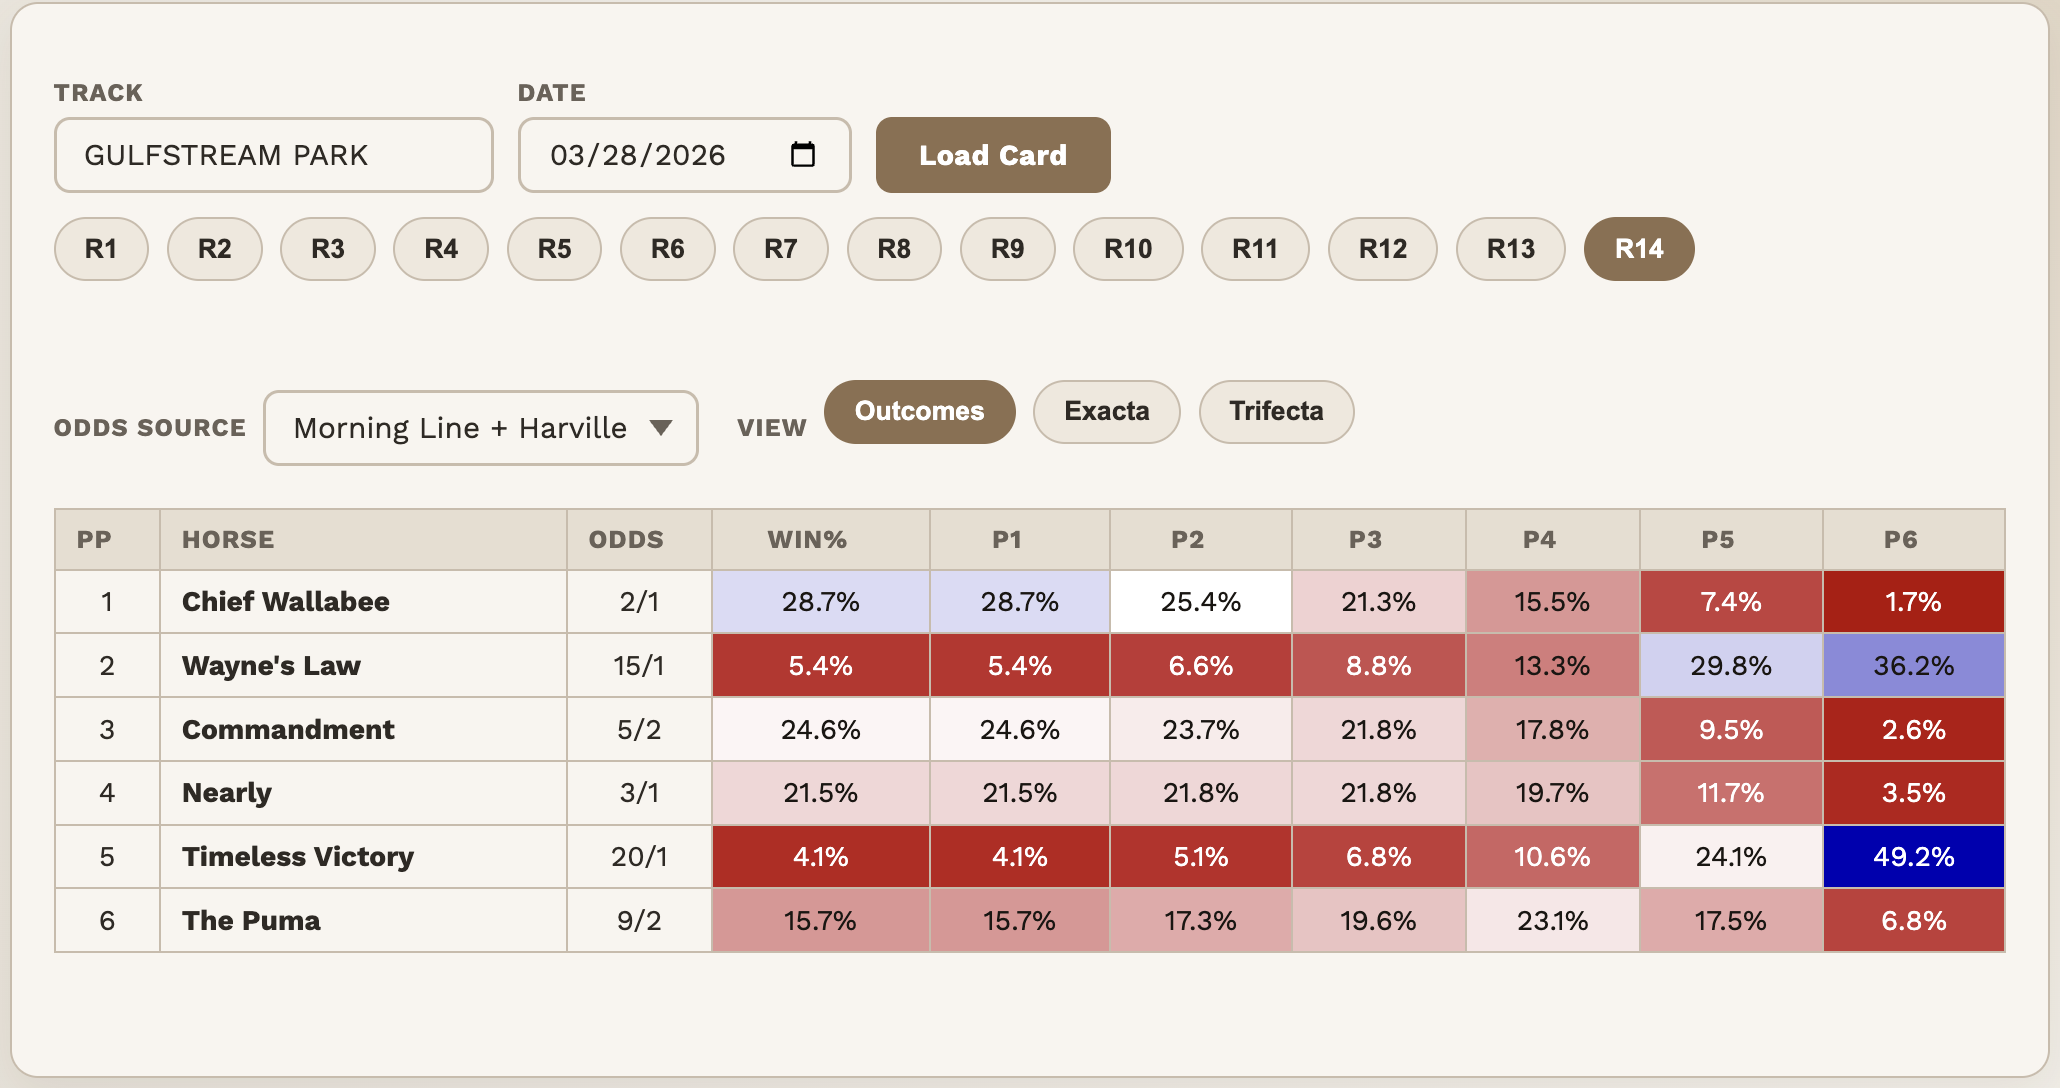
We’ll use the Florida Derby as our working example, with morning line odds as our estimate of win probability. There were a few scratches, so it won’t be perfect — but it’s enough. Probabilities are adjusted for takeout.
| # | Horse | Morning Line | Win Prob. | |
|---|---|---|---|---|
| 2 | Chief Wallabee | 2-1 | 28.7% | |
| 4 | Commandment | 5-2 | 24.6% | |
| 6 | Nearly | 3-1 | 21.5% | |
| 8 | The Puma | 9-2 | 15.7% | |
| 3 | Wayne’s Law | 15-1 | 5.4% | |
| 7 | Timeless Victory | 20-1 | 4.1% |
These probabilities add up to 100% — the required starting point for everything that follows.
How it works
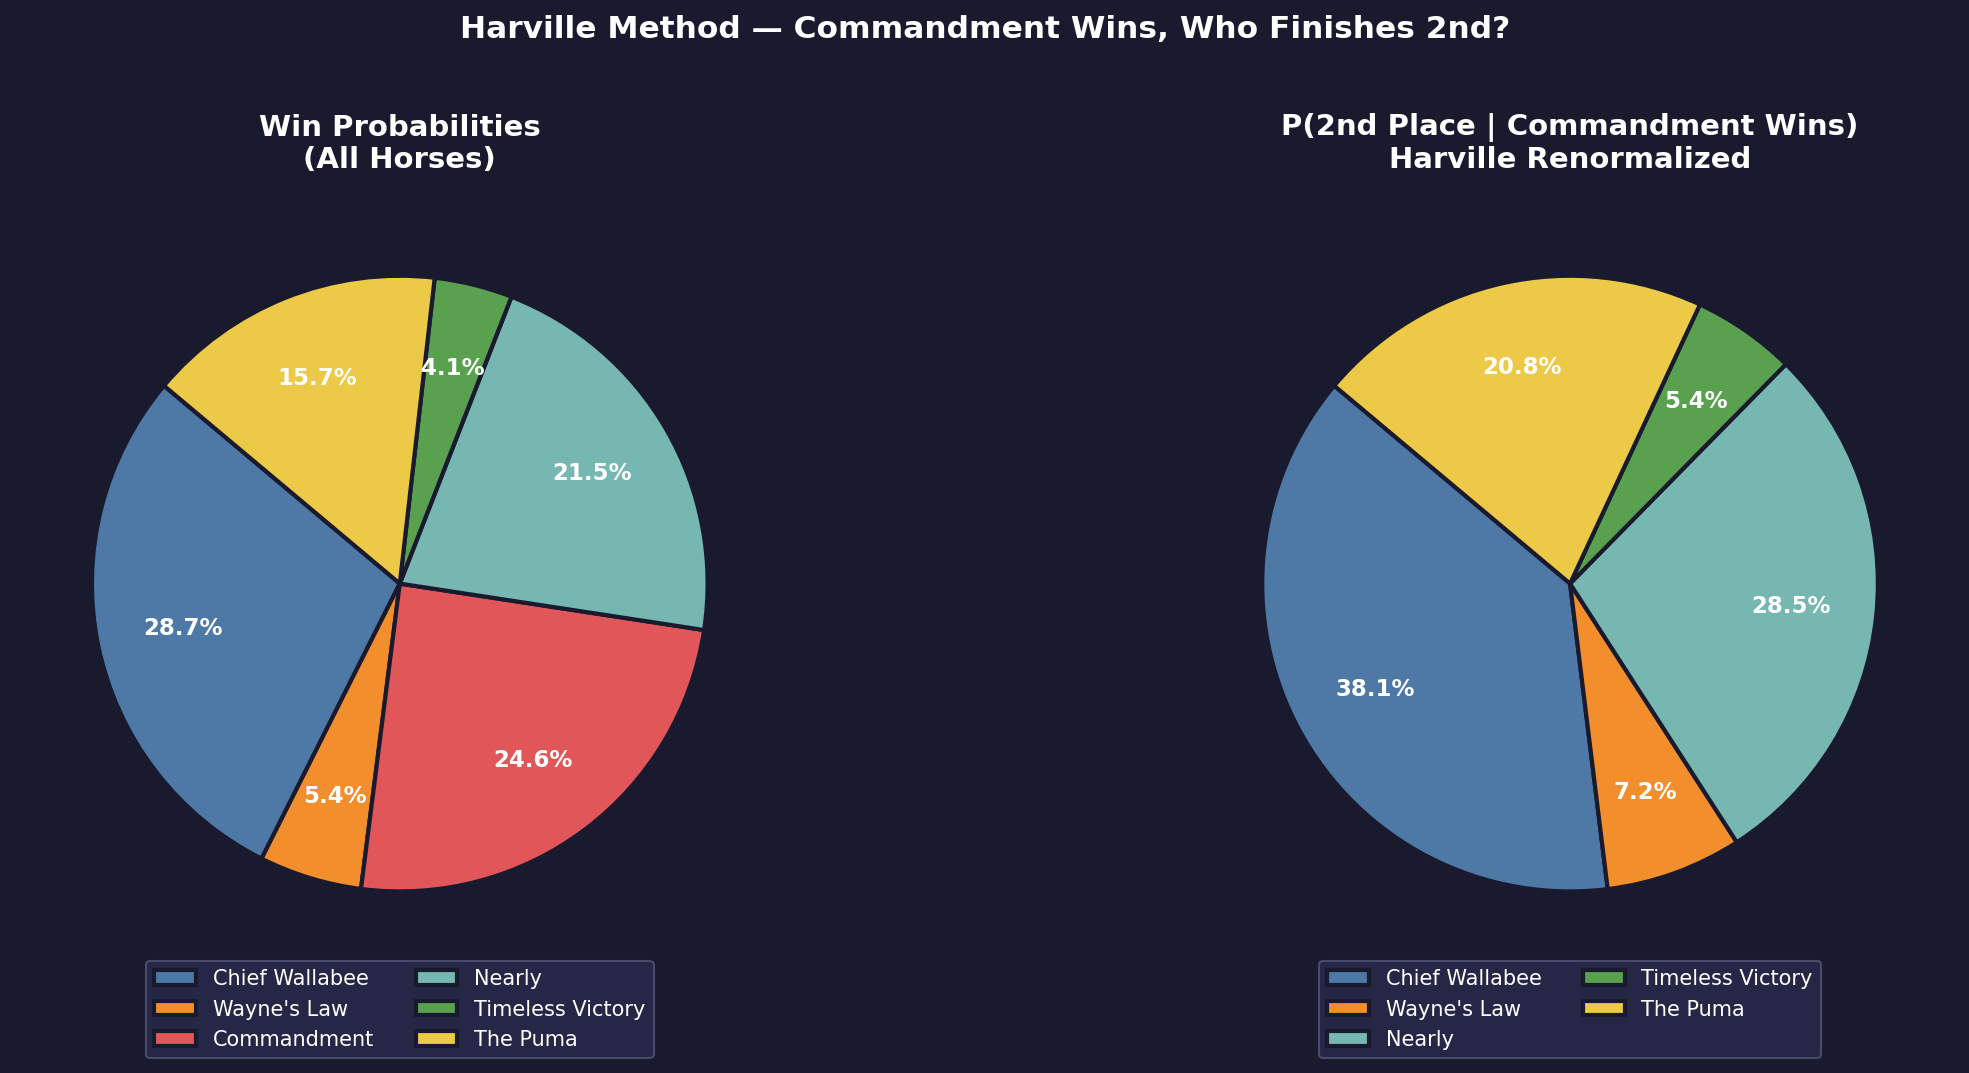
The Harville method asks a deceptively simple question: given that a particular horse won, what are the remaining horses’ chances of finishing second?
The answer it proposes is intuitive. Once you remove the winner from the field, redistribute the remaining probabilities proportionally. The second-place race is just a new, smaller race — run it the same way.
So to calculate a specific exacta — say, Commandment wins and Nearly places — you chain two things together:
- How likely is it that Commandment wins? (24.6%)
- Given Commandment won, how likely is Nearly to “win” the remaining five-horse field?
That second step is where Harville earns its keep. Nearly’s share of the five-horse field is his original probability divided by the total probability of the non-Commandment horses:
P(Commandment wins) × P(Nearly 2nd | Commandment won)
= 24.6% × (21.5% / (1 − 24.6%))
= 24.6% × 28.5%
= ~7.0% → roughly 13-1
A Commandment–Nearly exacta lands around 7%, or about 13-1. To build a full trifecta probability, you apply the same logic again: remove the first two horses, rescale the remaining field, multiply. It’s a chain of conditional probabilities, each step feeding the next.
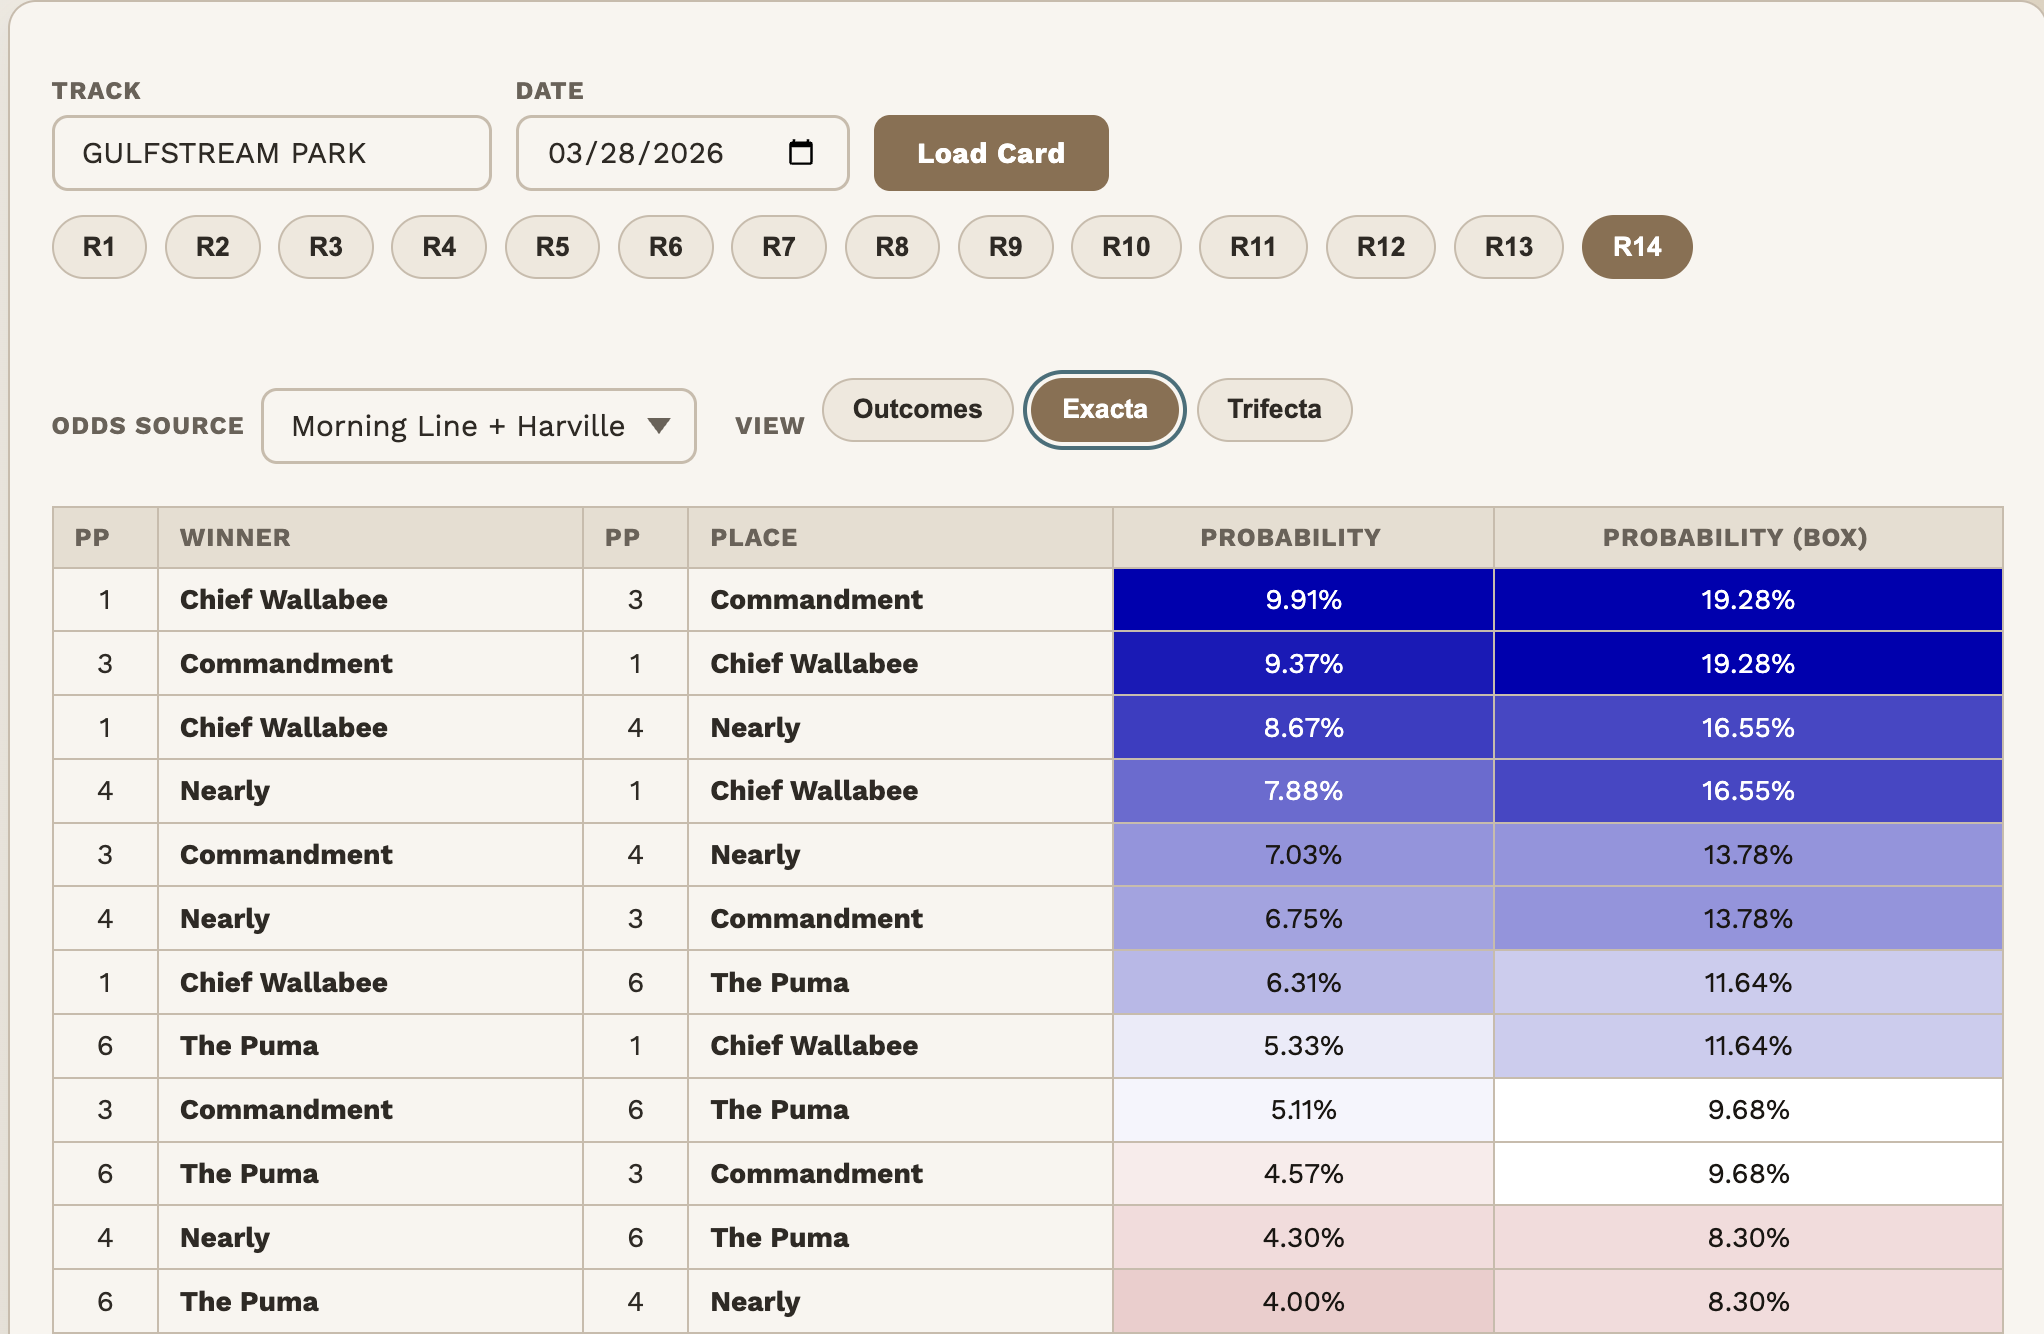
Sample exacta probabilities · Florida Derby
The tool
To spare you from Excel mayhem, there’s a calculator that handles all of this. Input closing line or morning line odds — your call — and it computes the rest. You can switch between individual finishing order probabilities, exacta probabilities, and trifecta probabilities (straight and boxed).
Prefer closing line odds for live races. Morning line is fine for early analysis, but the market tends to self-correct by post time.
See the Deep Outcomes tool here — be sure to switch to your preferred odds input.
Where it falls short
To Harville’s credit, he acknowledged the model was a simplification. All models are. The question is whether it’s a useful one.
- Win probability can’t capture everything The big assumption is that one number — win probability — fully describes a horse’s ability across all finishing positions. In reality, horses have profiles. Closers thrive in large fields. Front-runners collapse without the lead. Pace projections shape finishing order entirely. None of that nuance survives compression into a single percentage.
- It systematically overestimates favorites placing Data shows Harville inflates the probability of favorites running second or third, and underestimates it for longshots. A heavy favorite might win 60% of the time, but when they lose — a bad trip, a stumbling start, a jockey error — they can drop to fifth. Harville doesn’t account for how badly strong horses can underperform on a rough day.
- Horses don’t run independently In a real race, everything interacts. A pace-setter changes everyone’s dynamics. The rail plays differently for a stalker than a closer. Harville treats each horse as an isolated competitor, which is a clean assumption — and not an especially realistic one.
The bigger point
Despite its flaws, the Harville method matters because it’s a template for thinking clearly about sequential probabilities.
Most people confronted with a complex outcome — who finishes where across an entire field — either give up and guess, or collapse the problem to its simplest version: who wins? Harville offers a third path: a systematic way to build up from what you know toward what you actually want to estimate.
Knowing about Harville won’t make you rich. But it might stop you from doing something worse — trusting your gut on a trifecta payout when a principled framework was sitting right there.
Better questions lead to better bets. Harville is one tool for asking better questions about finishing order — and like any tool, its value depends on knowing when to use it and when to reach for something else.
Comments
No comments yet. Be the first to share your thoughts.
Have thoughts? Sign in to comment.